Answer to question a :
Don't use plagiarized sources. Get Your Custom Essay on
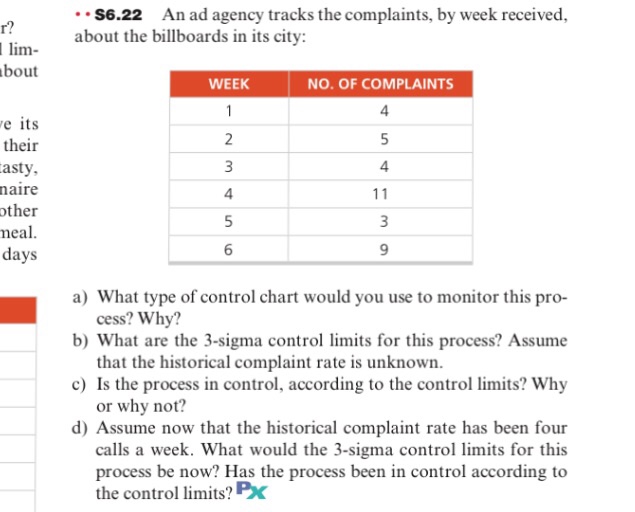
[SOLUTION] An ad agency tracks the complaints, by week received, about the billboards in its…..
From $8/Page
Choice of C hart will be the appropriate control chart to monitor this process.
C chart is used when counting total count of defects ( here that is ‘complaints’) per unit ( here that is ‘week)and is appropriate when the sample size is uniform . Here sample size for each case is “Week” and hence has an uniform sample size.
In case sample size was not uniform , c chart could not have been used and instead u chart would have been used.
Answer to question b :
Let , Cbar = Average number of complaints per week
Therefore, Cbar = ( 4 + 5 + 4 + 11 + 3 + 9) / 6 = 6
Thus 3 sigma control limits are :
Upper Control Limit ( UCL )
= Cbar + 3 x square root ( Cbar)
= 6 + 3x square root ( 6)
= 6 + 3 x 2.45
UPP
= 13.35
Centerline ( CL) =Cbar = 6
Lower control Limit ( LCL)
= Cbar – 3 x square root ( Cbar)
= 6 – 3 x 2.45
= 6 – 7.35
= – 1.35
However since derived result for CL is negative number, we must consider LCL = 0
| 3 SIGMA UPPER CONTROL LIMIT ( UCL ) = 13.35 |
| CENTERLINE = 6 |
| 3 SIGMA LOWER CONTROL LIMIT ( LCL) = 0 |
Answer to question c:
The data on number of complaints are : 4. 5, 4 , 11, 3 and 9 . It can be seen that all these data are within UCL of 13.35 and LCL of 0 . Therefore, it can be concluded that the process is in control.
Answer to question 4 :
Now the historical complaint rate = 4 calls a week
Therefore ,
C bar = Average of all historical complaint rates each of which is 4 = 4
Therefore,
3 Sigma Upper Control Limit ( UCL )
= Cbar + 3x Square root ( Cbar)
= 4 + 3 x Square root( 4)
= 4 + 6
= 10
Centerline = Cbar = 4
3 sigma Lower control Limit
= Cbar – 3 x Square root ( Cbar )
= 4 – 3 x 2
= 4 – 6
= – 2
However since LCL cannot be a negative number, we shall consider LCL = 0
Thus :
| Upper Control Limit = 10 |
| Center Line = 4 |
| Lower Control Limit = 0 |
It is to be noted that there is complaint data e.g 11 which is > UCL . Therefore it can be concluded that the process is out of control.
selected t-accounts of moore company are given below for the just completed year:
Also Read: [SOLVED] Interview Assignment Locate someone who is either an herbal specialist or an aromatherapy provider. Interview this person on their method of patient/client assessment and prescription methodology. · D